In a previous post I showed you how to add Prometheus metrics to a Blazor app on Fly.io using the OpenTelemetry NuGet packages. Fly makes capturing and displaying metrics simple with their built in Grafana dashboards. But sometimes there are events and metrics from the application layer that you’d like to track, such as how many views a particular piece of content got. Here I’ve created InstrumentationService.cs which I can easily inject into any Blazor component in order to increment a counter:
| |
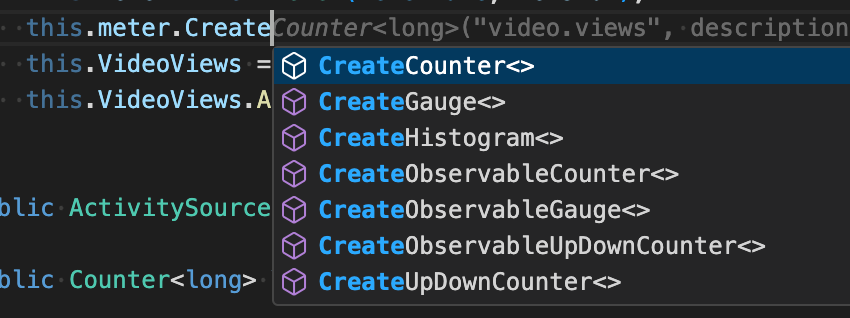
The important bit here is the meter, which can store any number of counters, histograms or gauges, including the VideoView counter I’ve created:
And then in the program.cs file, I make sure we add that service to DI:
| |
Also in the program.cs I’m adding all the standard ASP.NET instrumentation, plus my custom meter in InstrumentationService.cs:
| |
Then, when I need to increment a counter in a Razor component, I can inject the service:
| |
And simply call the AddMethod on the VideoViews counter:
| |
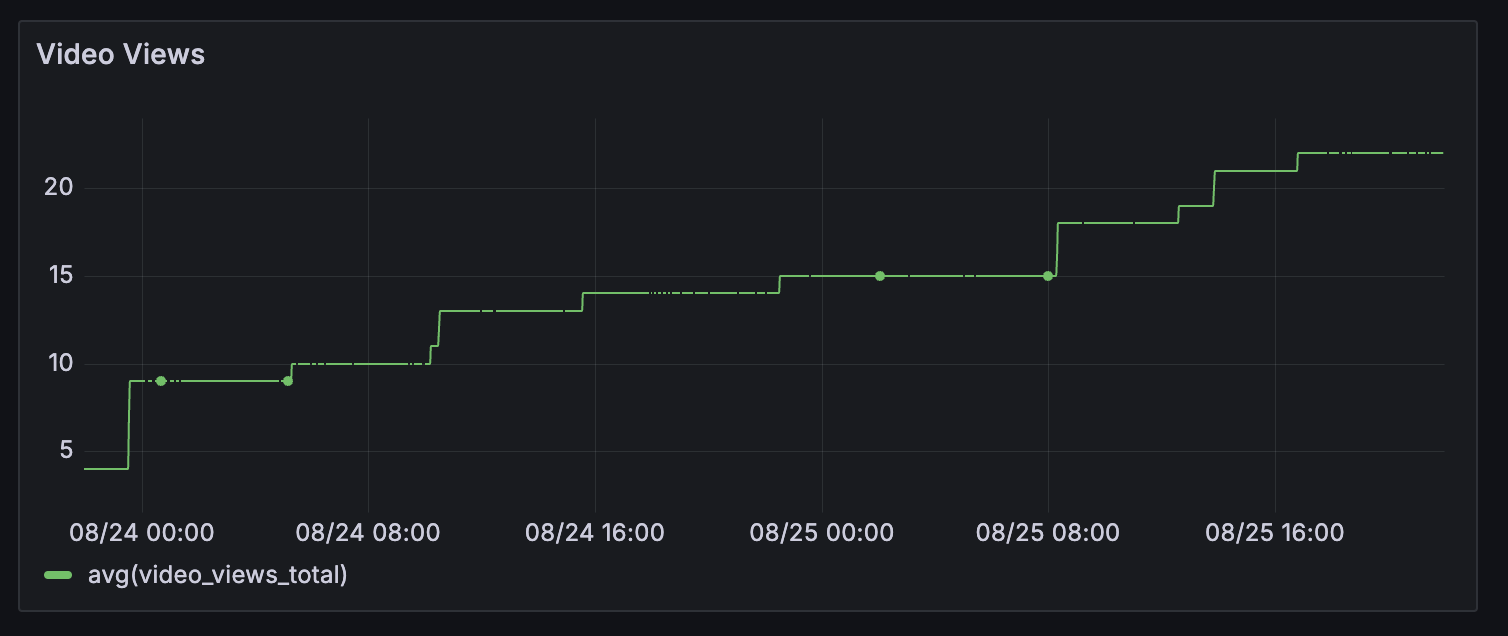
And in your Grafana instance, you can create a new dashboard referencing that metric:
Conclusion
In conclusion, adding custom Prometheus metrics to a .NET application is straightforward. By creating an InstrumentationService and injecting it into Blazor components, you can easily track events and metrics at the application layer. With Grafana dashboards, you can visualize and analyze the collected data, gaining valuable insights into your application’s performance.